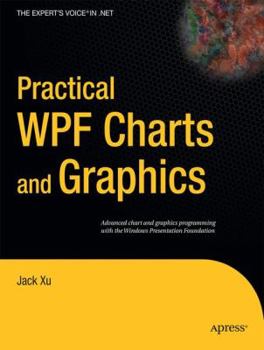
Practical WPF Charts and Graphics: Advanced Chart and Graphics Programming with the Windows Presentation Foundation
Select Format
Select Condition 
Book Overview
Creating 2D and 3D charts is one of the most common uses of computer graphics. Such charts can have wide applications in representing mathematical, physical, and economic functions in your daily life. Whether you are an engineer, a quantitative analyst, a teacher, or a student, you will end up dealing with charting applications to some degree. Windows Presentation Foundation (WPF) is a next-generation graphics platform that enables you to...
Format:Paperback
Language:English
ISBN:1430224819
ISBN13:9781430224815
Release Date:November 2009
Publisher:Apress
Length:712 Pages
Weight:2.20 lbs.
Dimensions:1.5" x 7.5" x 9.2"
Customer Reviews
0 rating


