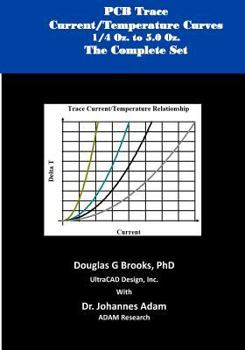
PCB Trace Current/Temperature Curves 0.25 Oz. to 5.0 Oz: The Complete Set
Brooks has been looking at these relationships since the mid '90s, and entered into a multi-year collaboration with Johannes Adam in 2014. And he has assembled 27-plus years of knowledge into these pages. Detailed PCB trace current/temperature charts cover 7 trace thicknesses and 11 trace widths: 1/4, 1/2, 1.0, 2.0, 3.0, 4.0, and 5.0 Oz trace thicknesses and 15, 25, 50, 80, 100, 150, 200, 250, 300, 400, and 500 mil trace widths. The text summarizes the factors that influence trace heating (i 2R) and trace cooling (thermal conductivity through the dielectric, convection, and radiation.) Internal traces are cooler than external traces because the thermal conductivity through the dielectric is more efficient. The change between internal and external temperatures increases as the external temperature increases, and also as the trace depth increases. Guidelines are provided to help estimate an internal trace temperature based on what the external temperature is/would be and the relative depth of the trace. The charts are based on the work Brooks and Adam did in their recent book, "PCB Trace and Via Temperatures: The Complete Analysis," 2nd Edition, 2017 (available on Amazon.com) and on subsequent modeling using Dr. Adam's simulation software Thermal Risk Management (TRM). Table of Contents 1.0 Introduction and Background 2.0 Description 2.1 Factors Leading to Heating 2.2 Factors Leading to Cooling 2.3 How Hot Is Too Hot? 3.0 Internal Traces 4.0 Accuracy 4.1 How Do We Measure Trace Temperature 4.2 Estimate Accuracy 5.0 Current Temperature Charts Notes and References Appendices
Format:Paperback
Language:English
ISBN:1722839791
ISBN13:9781722839796
Release Date:July 2018
Publisher:Createspace Independent Publishing Platform
Length:30 Pages
Weight:0.20 lbs.
Dimensions:0.1" x 7.0" x 10.0"
Customer Reviews
0 rating


