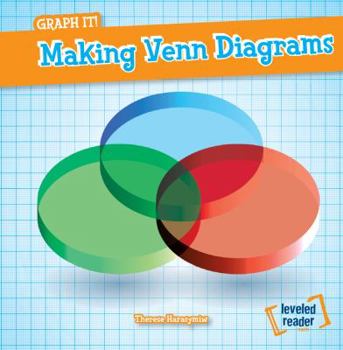
Making Venn Diagrams
Venn diagrams are a visually effective method of showing how sets of data intersect. Though Venn diagrams are often used as graphic organizers in other classrooms, they are just as important to the math classroom. Readers are introduced to some kinds of Venn diagrams they may encounter and follow step-by-step instructions to make their own. Questions and an answer key help them assess their understanding of this valuable topic.
Format:Library Binding
Language:English
ISBN:1482409348
ISBN13:9781482409345
Release Date:August 2014
Publisher:Gareth Stevens Publishing
Length:24 Pages
Weight:0.40 lbs.
Dimensions:0.3" x 7.0" x 7.1"
Age Range:6 to 8 years
Grade Range:Grades 1 to 3
Customer Reviews
0 rating


