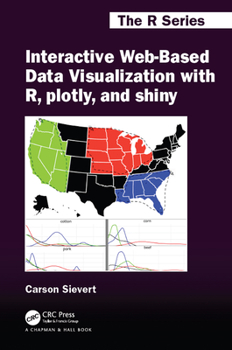
Interactive Web-Based Data Visualization with R, Plotly, and Shiny
Select Format
Select Condition 
Book Overview
The richly illustrated Interactive Web-Based Data Visualization with R, plotly, and shiny focuses on the process of programming interactive web graphics for multidimensional data analysis. It is written for the data analyst who wants to leverage the capabilities of interactive web graphics without having to learn web programming. Through many R code examples, you will learn how to tap the extensive functionality of these tools to enhance the presentation and exploration of data. By mastering these concepts and tools, you will impress your colleagues with your ability to quickly generate more informative, engaging, and reproducible interactive graphics using free and open source software that you can share over email, export to pdf, and more.
Key Features:
Convert static ggplot2 graphics to an interactive web-based form
Link, animate, and arrange multiple plots in standalone HTML from R
Embed, modify, and respond to plotly graphics in a shiny app
Learn best practices for visualizing continuous, discrete, and multivariate data
Learn numerous ways to visualize geo-spatial data
This book makes heavy use of plotly for graphical rendering, but you will also learn about other R packages that support different phases of a data science workflow, such as tidyr, dplyr, and tidyverse. Along the way, you will gain insight into best practices for visualization of high-dimensional data, statistical graphics, and graphical perception. The printed book is complemented by an interactive website where readers can view movies demonstrating the examples and interact with graphics.


